Happy Hump Day! My apologies right off for such a head scratching title but this is where I am most days when I see economic reports like the recent jobs report (last week) from the Bureau of Labor and Statistics (report is here: January BLS Report 1 24 ) The news is good, maybe, kind of, OK not as great, could be better, layoffs are happening now, what does it all mean? As a colleague said to me the other day, “make it make sense”. So here goes.
First, the BLS report from last week includes annual adjustments for population changes and seasonality tweaks. This means that the numbers are somewhat skewed in comparison to previous period reports. This happens annually.
There are two components to the BLS report – the Establishment survey data and the Household survey data. The Establishment data is the “headline” data that is pushed through the news cycles. The Establishment data is basically a survey of payroll data that is used to measure jobs. The Household data is a census driven sample of representative households used to determine the labor force. The Household survey’s most common measurement is the national unemployment rate.
Both surveys with corresponding data, when released, can be quite misleading – good and bad. The first release is followed by other releases that adjust or refine the initial results reported. It is the follow-up releases that rarely get reported. One key stat element that is important for analysis purposes is how jobs are counted and employment factored between the Establishment and the Household surveys. In the Establishment survey, jobs are counted regardless of who holds them. In this methodology, a person working two jobs is irrelevant as the count figures two jobs. In the Household survey, even if the person is working two jobs, he/she counts only as one individual, employed. The way to really source the impact of this methodology is to look through the data on percent of population employed and the workforce participation rate.
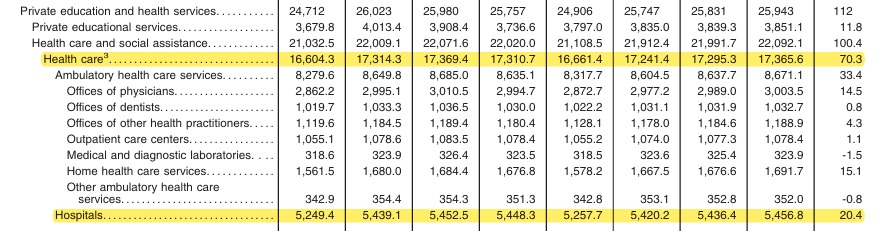
I’m a healthcare guy, so to speak, so with the above information as a backdrop, healthcare jobs data from the last report (available in the first paragraph) is the focus of this post. The data points worth noting are as follows.
- Healthcare employment grew by 3.9% in 2023, 2.5 times faster than all other industries, growth of 1.5%.
- One in four jobs created in 2023 was in healthcare.
- Non-seasonally adjusted healthcare jobs grew by 700,000 (annual) and seasonally adjusted, about the same.
- Hospital job growth, non-seasonally adjusted, was just under 200,000 (annual) and seasonally adjusted, about the same. See chart below.
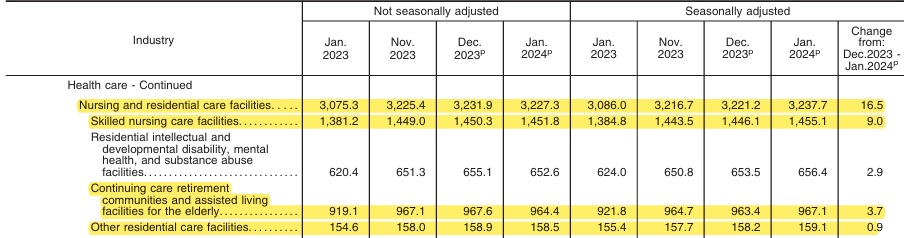
- Nursing and residential care job growth was 152,000 annually with SNF growth representing 70,600 of that total.
- Continuing care and assisted living job growth came in at 45,300 for the year.
- Healthcare added 70,000 jobs in January 2024, 20,000 coming from hospitals and 33,000 from ambulatory care settings.
So now, for the “make it make sense” part of the question my colleague asked. The report is a bit of a Dr. Jekyll and Mr. Hyde tale. Healthcare job growth is strong, primarily measured on a post-pandemic level. Nursing and residential care for example, continue to run below pre-pandemic levels – 4.6%. This is definitely due to staff disaggregation during the pandemic, ongoing staffing challenges, and closures.
Another issue that needs to be dissected which, I can’t do in this post, is the number of payroll jobs consumed by one person, working two jobs. Those of us in healthcare know this is a real phenomenon. Remember, the Establishment report is payroll, not discerned enough by who is taking the payroll and whether the jobs are full or part-time. Likewise, contractor data or jobs filled by contractors don’t readily show in the Establishment data but should show in the Household survey data. Thus, the view on the ground as an employer in healthcare could be and generally is, quite different than the jobs data that is broadcast. As my colleague said, if all these jobs are created, “who is filling them?”
Healthcare openings persist and will for an extended period of time. Jobs are abundant but the population by desire, by skill, and by location to fill them is another matter. Some quick snapshots from the BLS report are below.
- Unemployment rate (U-3) remains at or very near to 3.7%. Unemployment is impacted positively and negatively, by people in the workforce looking for work.
- The civilian labor force, seasonally adjusted, grew year-over-year by 1.4 million.
- The percent of the population working remained stable – 60.2%
- Labor participation rates also remained unchanged – 62.5%
- Unemployment grew by 400,000, year-over-year.
- Part-time workers increased by nearly 400,000 – seasonal workers typically.
- Multiple job holders grew by nearly 300,000.
Happy Hump Day! As labor issues remain such a huge factor for all healthcare sectors, I’ll continue to watch and cover trends as best as I can. Data sources are plenty, but data accuracy can be sketchy, with government being the sketchiest as of late.
Leave a Reply