From May 2023 to May 2024, the overall healthcare costs accelerated (increased) by 3.4%, marking the most rapid increase since December 2007, as reported in Altarum’s monthly Health Sector Economic Indicators brief, released yesterday. The report is available here: Altarum-June-2024-HSEI-Combined
Expenditures on nursing home care increased by 4.8% year-over-year, while home healthcare spending saw a 2.5% rise.
“The growth rates for both nursing home care and home healthcare were considerably lower compared to the previous year, with May 2023 seeing a 6.4% increase from the preceding May (22) for nursing home care, and a 4.4% increase for home healthcare,” the report noted.
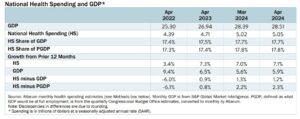
Worthy to note, especially in this election cycle, is that healthcare spending has eclipsed the $5 trillion mark, rising 7.1% April to April (23 to 24), now at 17.1% of GDP. Some highlights below.
- In April 2024, the nominal GDP was 5.9% higher compared to April 2023, marking a growth that was 1.2 percentage points slower than that of health spending.
- Personal health care spending saw a 7.6% increase from the previous year, with the growth in utilization still surpassing that of prices.
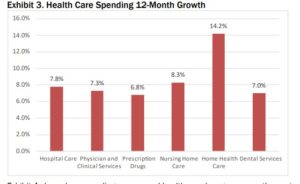
- Among the major spending categories, home health care experienced the highest growth at 14.2% year over year, whereas prescription drug spending had the slowest growth rate at 6.8%.
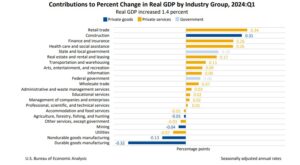
In terms of contribution to GDP growth, health spending remains, along with government spending (arguably, the significant driver of health spending), among the largest contributing elements.
As the U.S. population ages, health spending continues to (and will continue to) increase faster than other elements of GDP, though most recently, interest cost on the national debt has accelerated faster than all other spending components. In fact, the U.S. spends more per capita (2022 dollars) than other comparable industrialized nations and double a comparable country average.
![]()
In any given year, a small segment of the population accounts for a significant portion of total health spending. Discussions on health spending often center on averages, yet the health status of individuals—and consequently their healthcare needs—fluctuates throughout their lives. Indeed, the spending of very few individuals aligns with the average. In the U.S., those over the age of 55 are responsible for more than half of the health spending. How do health expenditures vary across the population? – Peterson-KFF Health System Tracker
Spending on home health care has experienced the most rapid growth, at 14.2%, compared to the more modest growth in retail spending on prescription drugs, which stands at 6.8%. According to this month’s HSEI Price Brief, the surge in home health care spending is mainly due to an increase in utilization, contributing 11.7 percentage points to the 14.2% growth, rather than to price hikes.
As I look at the various spending components of GDP and the drivers within health spending, the picture becomes a bit more alarming. First, aging demographics and a population full of lifestyle related illnesses (think Ozempic for weight-loss) such as Type II diabetes heavily related to diet and a sedentary lifestyle. Second, cost drivers such as labor. Healthcare labor remains tight by supply and wages have risen dramatically in and across the entire industry, but more so in certain sectors. Third, government regulation and litigation continue to add costs. Insurance (liability) has risen and advancing regulations in infection control (COVID), health equity, staffing mandates, all are contributing mightily to cost increases. It’s no wonder that health care is the leading input to “Services” (household consumption) in GDP.

Some other interesting data elements from the Altarum report involved health care prices and labor.
- Prices: In May, the overall health care price index (HCPI) saw a year-over-year increase of 3.4%, a rise of 0.5 percentage points from April’s slightly revised growth of 2.9%. This marks the most rapid increase in health care prices since December 2007, with the current rate surpassing the growth of both the overall Consumer Price Index (CPI) and Producer Price Index (PPI). Health care services remain the primary contributors to this growth, with dental care services rising by 5.1%, nursing home care by 4.8%, and hospital care by 4.2%. Additionally, prescription drug prices experienced a significant uptick this month, with year-over-year growth climbing from 0.4% in April to 2.4% in May. Prescription drug prices also rose by 2.1% on a month-over-month basis in May, which is an unusual deviation from the typical pattern of significant increases in January (e.g., 2.1% in January 2023 and 1.3% in January 2022).
- Labor:In April 2024, job openings in the health care and social assistance sector decreased by 204,000 (11.7%) compared to March, despite a 9.7% increase in job separations and a modest 3.1% increase in hires. In May, employment in the health care industry rose by 68,300, surpassing the 12-month average of 65,200. This growth was primarily in ambulatory health care services, which added 42,700 jobs. Hospitals and nursing and residential care facilities also saw increases, adding 15,000 and 10,600 jobs, respectively. Overall, the economy gained 272,000 jobs in May, exceeding the 12-month average of 229,670, although the unemployment rate ticked up to 4.0%. Health care wages grew by 3.3% year over year in April, less than the 4.1% growth in non-health care industries. The highest wage growth within health care was in nursing and residential care facilities at 4.3%, followed by ambulatory health care services at 3.3% and hospitals at 2.8%.
Out of office travel tomorrow so no new posts until next week. Wishing everyone a great weekend and TGIF in advance!