Happy Hump Day! The National Investment Center released its third quarter 2023 lending trends report and while the data is a bit old, it is reflective of current market conditions. The report is available here: NIC_Lending__Trends_Report_3Q2023
Suffice to say since I last provided an update on this subject area, things have not improved. Capital access and credit remain tight, all sources. The primary driver of this tightness is affordability, expressed as interest rates, issuance cost, and resultant servicing costs. Given no indication from the Fed (more below) of a near term reduction in rates, the paradigm of the fourth quarter carries into 2024. Some observations from the NIC report are,
- Higher loan expenses due to higher interest rates are impacting senior housing property assets, creating challenges for most looking for capital and distress for others (repricing). The sector anticipates billions of dollars maturing this year, nearly all in need of refinancing.
- Third quarter data points mirror second quarter – stable but “yucky” (my technical term).
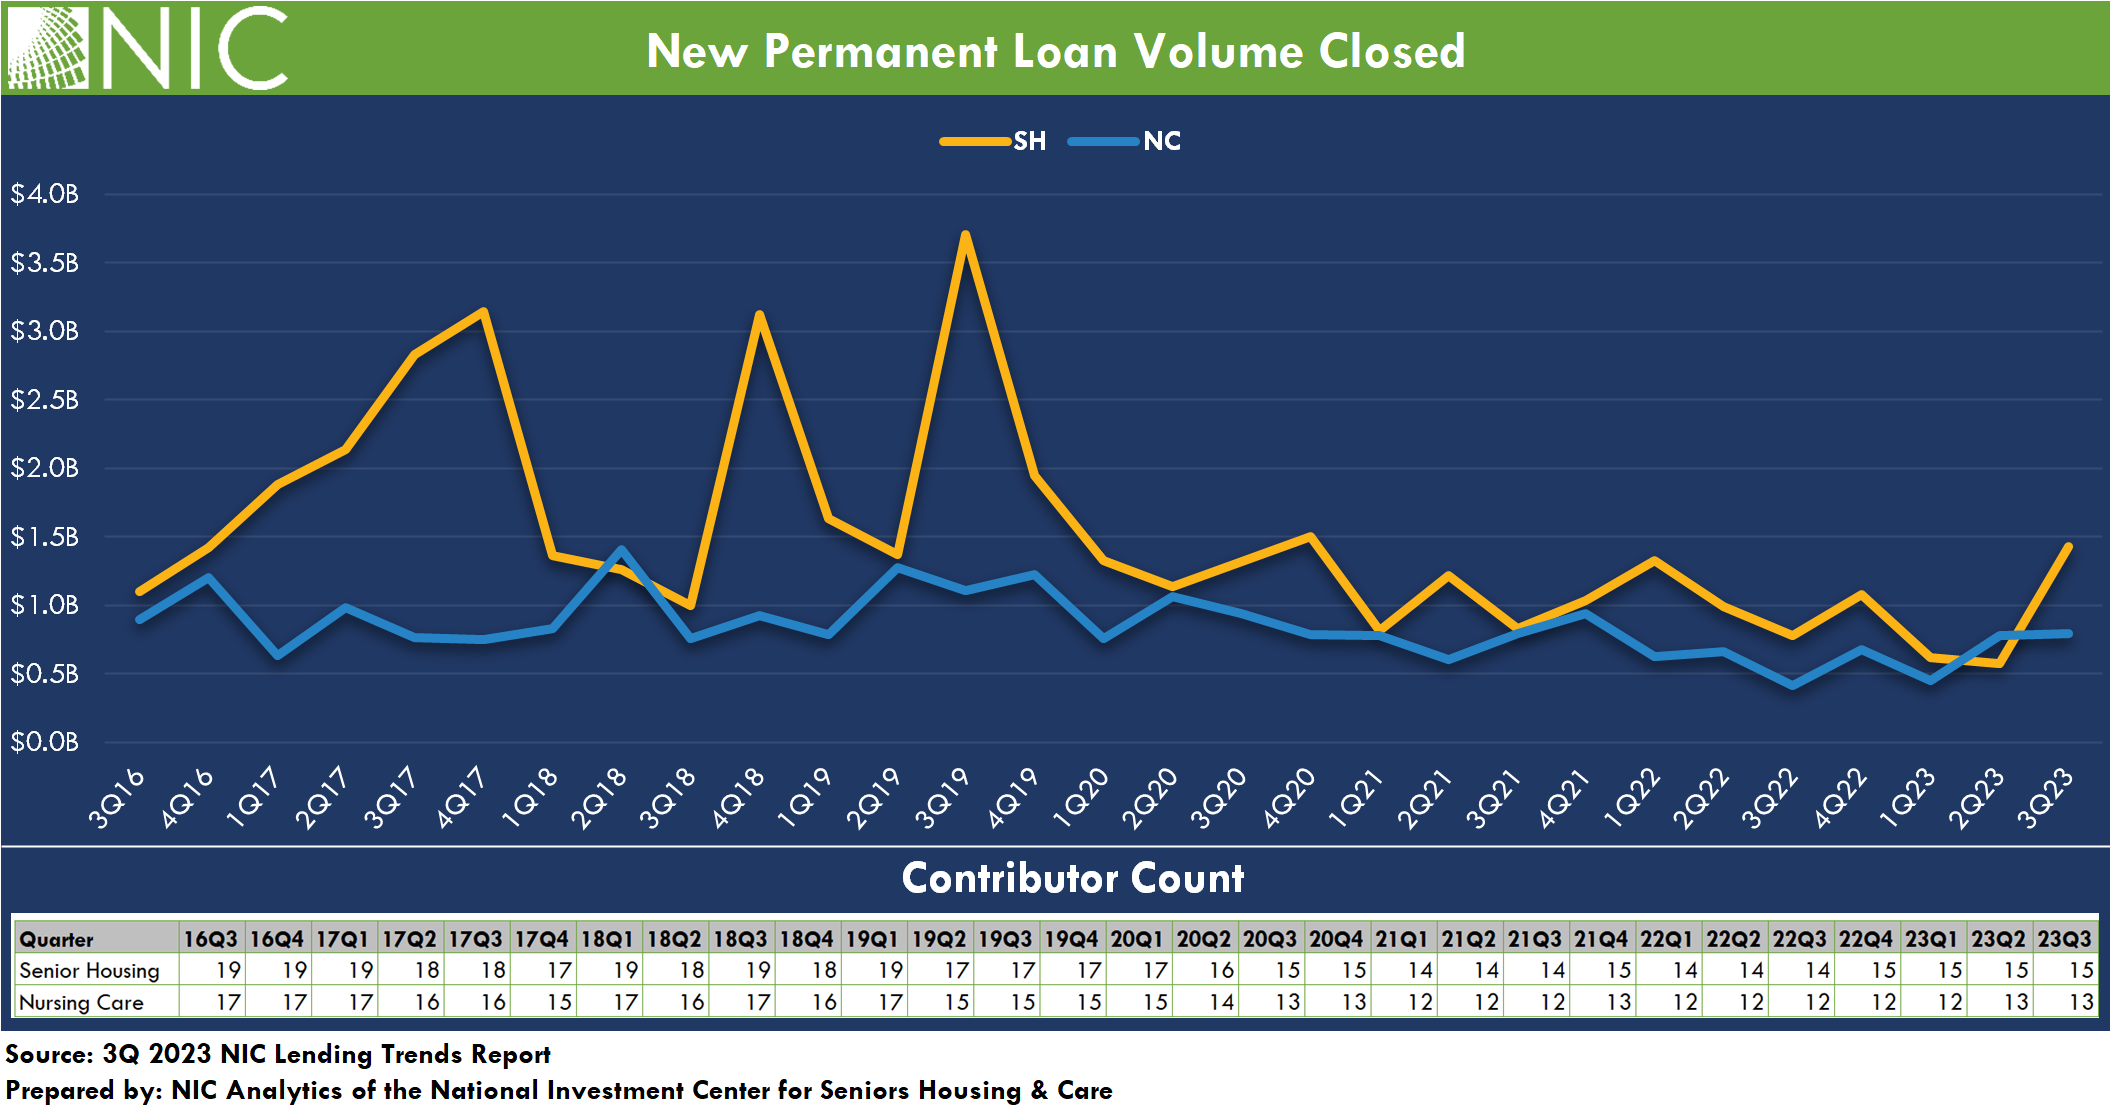
- The issuance of new permanent debt for senior housing increased during the third quarter 2023. The volume of new permanent loans closed for senior housing increased to $1.43B – a 150% increase from the prior quarter. This increase implies that some lenders and borrowers are adjusting to changing capital market and credit conditions and locking in long-term interest rates. Notably, this level is still considerably below pre-pandemic 2020.

- There was continued decline in mini-perm/bridge debt issuance for senior housing, reflecting a 46% decrease from the prior quarter and 87% from late 2022 levels. Similarly, nursing care mini-perm/bridge loan closings, while slightly higher than those in senior housing for the past two prior quarters, remained low and similar to pre-pandemic levels. Borrowers continue to adjust to the prevailing “higher for longer” likelihood, anticipating sustained rates without a potential decline in the near future. Short-term debt options are limited, what is available often comes with increased costs and additional credit enhancements (more equity or additional payment guarantees such as a letter of credit or pledged investments, etc.).
- New construction starts remain low. The number of senior housing units under construction in the 31 NIC MAP Primary Markets remained near their lowest level since 2015. There is no indication of a correction in the construction market (capital or cost) anytime in the near to moderate future, suggesting 2024 will be approximately the same as 2023. Nursing care construction is all but non-existent.
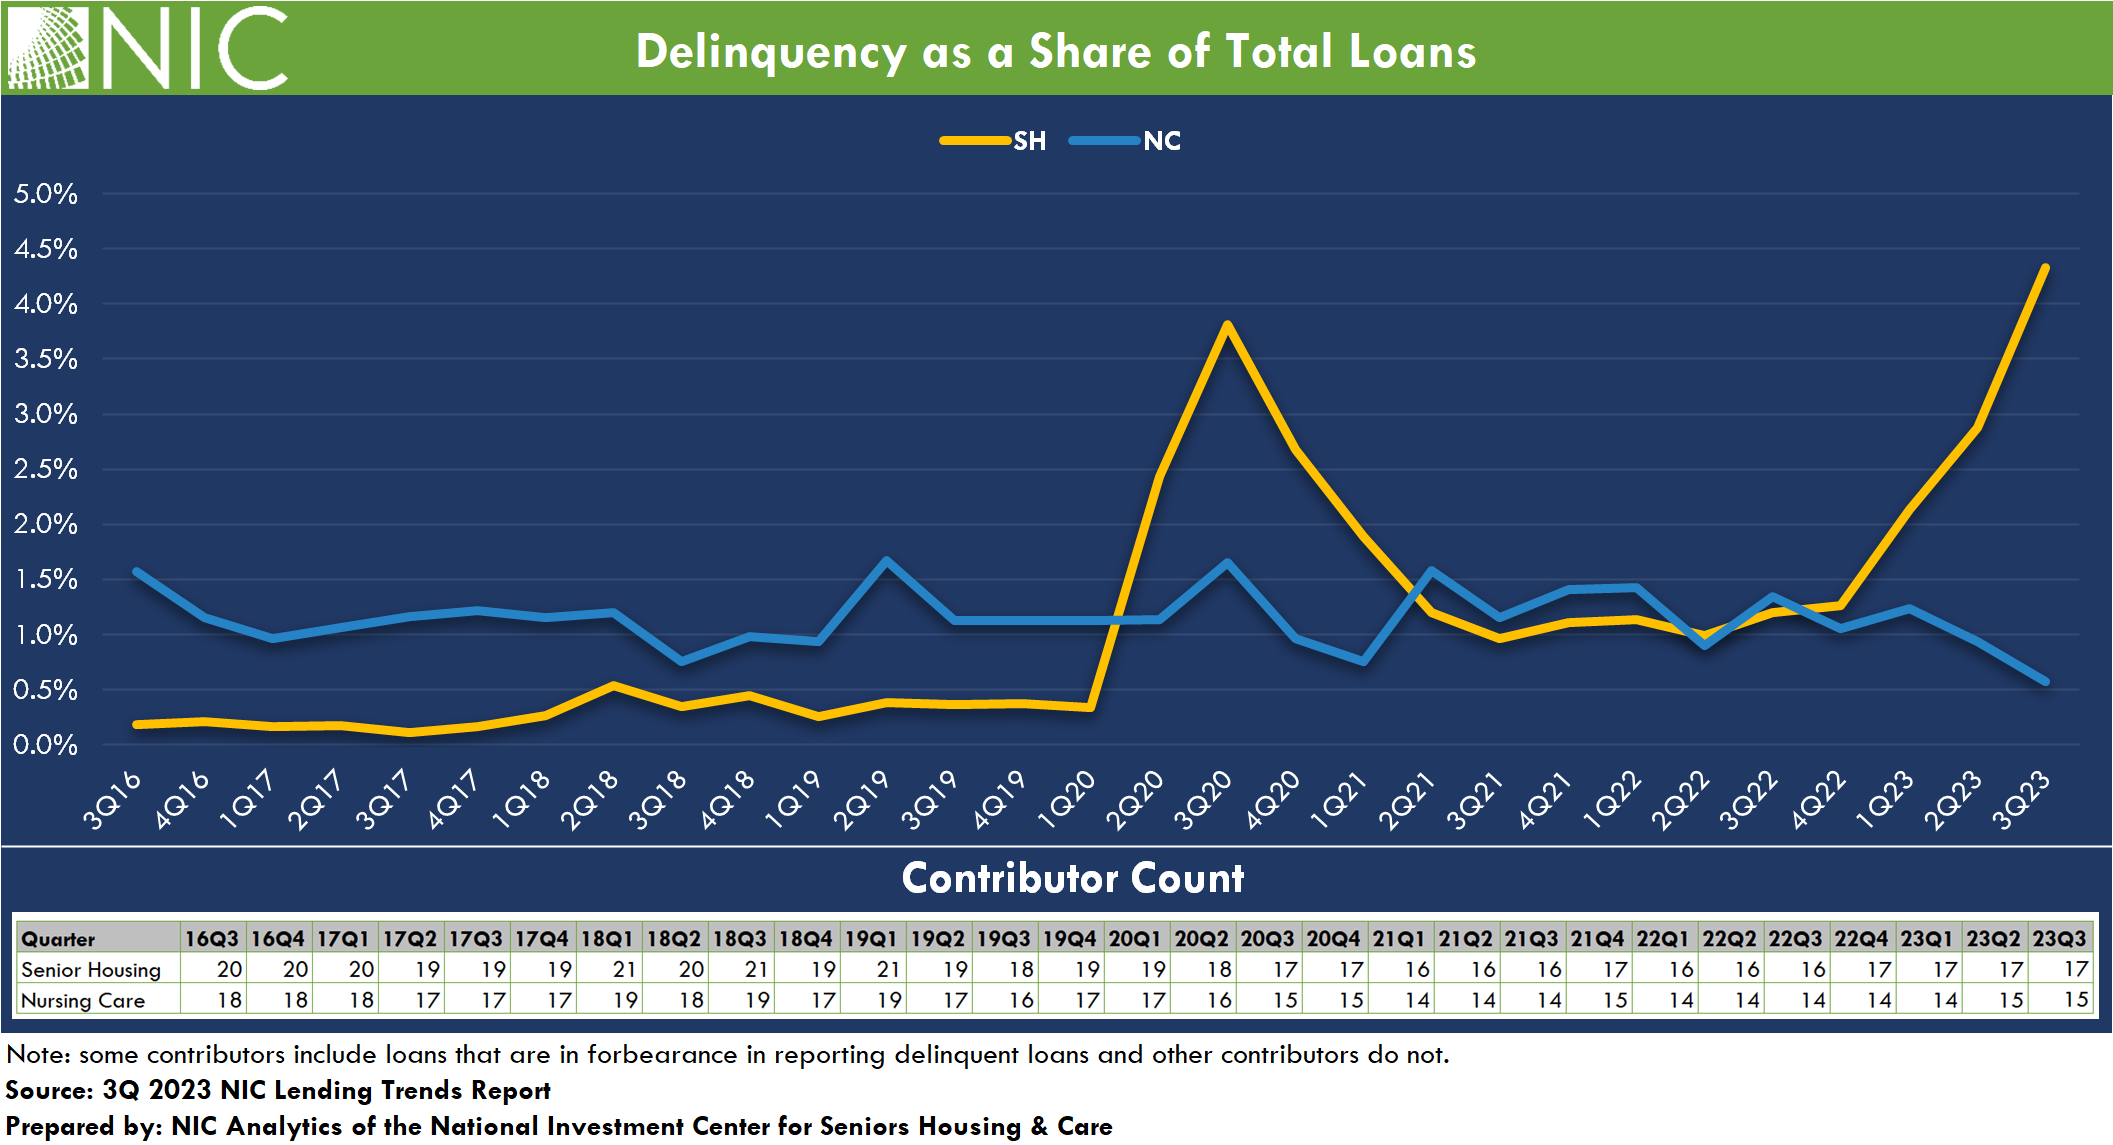
- The balance of delinquent loans for senior housing saw a significant increase. Delinquencies in senior housing rose by 50% in the third quarter 2023 while those in nursing care declined by 38% from the prior quarter. Delinquencies as a share of total loans rose to 4.3% for senior housing, up from 2.9% in the second quarter of 2023 and 1.3% in late 2022. For nursing care, the delinquency rate edged down to 0.6% from 1.1% in late 2022. Loans in forbearance are reported in the delinquent loan data for some debt providers. Foreclosures reported for the third quarter 2023 for both senior housing and nursing care were $20.2M and $14M, respectively.

For rate watchers, the minutes of the last two Federal Reserve discount rate meetings were released today. Suffice to say, I watch the Fed stuff pretty closely but only as a contributing part to an overall picture made-up of lots of data points. What I glean from the Fed information and their various speeches via the Governors, rates are going nowhere (down) any time soon. I don’t foresee any rate reductions until mid-year at best, likely more third quarter. Anyone interested in the discount rate meeting minutes summary statements, they are available here: Fed Discount Rate Meeting Minutes Jany 2024
This Fed is cautionary and wishes to forego a roller coaster situation with monetary policy (rates reduce, inflation rises, rates need to increase, etc.). This week we get PCE data, and that measure is likely to be a touch hotter (PCE is a measure of how much households spend on goods and services), as CPI data often reflects on PCE. We saw hotter services costs and rent costs so assumptively, there will be some translation to PCE.
To give readers just a tiny flavor of the economic conditions present that can (and do) impact Fed monetary policy and credit market activity (positively and negatively), here are some of the most recent data points on economic activity (I watch these consistently, as they give a good overall picture of where the economy is). Happy Hump Day!
- Consumer Confidence came out yesterday, a leading indicator of how consumers are feeling about the economy. Remember, about 60% of U.S. economic activity is driven by consumption. The Consumer Confidence Index fell in February to 106.7 (1985=100), down from a revised 110.9 in January. February’s decline in the Index occurred after three months of gains. Because January was revised down from the preliminary reading of 114.8, the data suggests that there was not a material breakout to the upside in confidence at the start of 2024. Overall inflation and concern about the labor markets drove consumer confidence down. https://www.conference-board.org/topics/consumer-confidence
- The Producer Price Index for final demand increased 0.3 percent in January. Prices for final demand services rose 0.6 percent, and the index for final demand goods decreased 0.2 percent. The index for final demand advanced 0.9 percent for the 12 months ended in January. Rising producer prices inflated final prices on the consumption end.
- The earnings reports of major retailers, save Wal-Mart, show overall weakness. Lowes and Home Depot reported significant reductions in sales. Transport giants UPS and Fed Ex also showed big dips in sales – indicative of a slowed and slowing economy. Some say these bell weather stocks can be harbingers of a recession.
- The Case-Shiller index of housing prices data from yesterday shows a continued rise in housing prices reporting a 5.5% annualized gain in December of 2024. According to Redfin (real estate giant) the median home price in January of 2024 was $405,000 and the national average mortgage rate at the time (they have since ticked back up) was 6.6%. This means a buyer of a median priced home would need today, a downpayment of $81,000 (20%) to achieve a monthly mortgage payment (principal and interest) of $2,072.45, before any imputed costs of property tax or homeowner insurance.
1 thought on “Wednesday Feature: Lending Trends Still Reflecting a Tight Capital Environment”