Happy Hump Day! Advent has begun and soon, Chanukah will kick-off. ‘Tis the season or seasons. I will no doubt say this (or write it) many times over, but it always bears repeating, Happy Holidays to all!
Yesterday, I wrote a post about Fitch Rating’s and their outlook for CCRCs/Life Plan communities for 2024. Fitch maintained the same dour outlook for 2024 as it had for 2023 – deteriorating. Why? To use a well-worn, old political phrase from a Bill Clinton campaign, “It’s the economy, stupid”. Simplified, the economy is to blame for the negative outlook.
I watch economic data closely. It is an occupational requirement and/or hazard. Lately, the data I’ve been looking at is flashing “recession”; now or soon ahead. From all indications, the holiday shopping season will be “meh” as consumers are tapped-out on the credit card. And, while inflation has slowed, prices have not fallen for most commodities, leaving the consumer choosing between necessities and gifts.
Despite a wholesale push by the Biden Administration to make Bidenomics look like it is making the economy better, the plain truth is that the economy is showing signs of weakness, faltering demand, and now, falling job prospects.
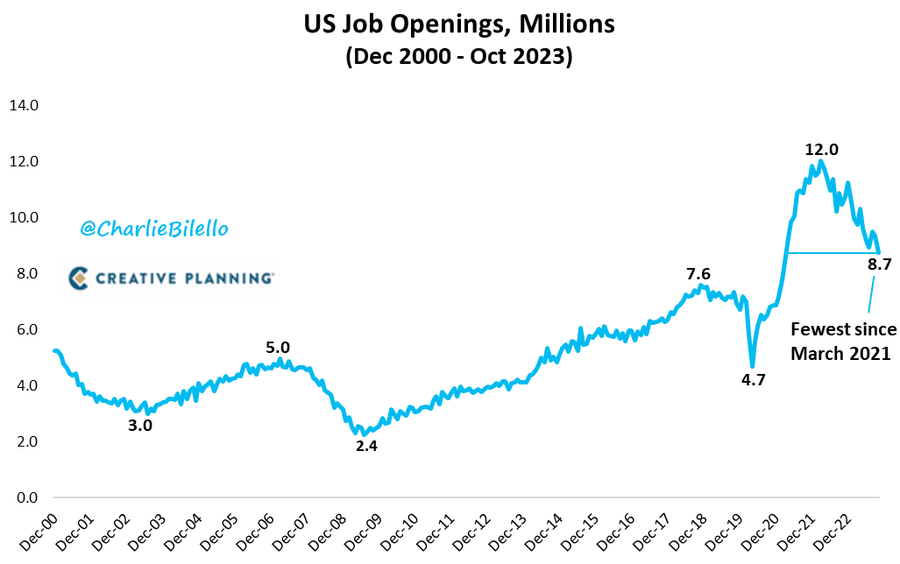
Yesterday, the JOLTS report (Job Openings and Labor Turnover Survey) for October came out, Job openings sliding to 8.7 million, the lowest since March of 2021. The softening for labor (demand) was spread across many industries.

Notably, the report and reduction of job openings would be higher had government openings not increased. Increasing government jobs does little to nothing for GDP growth via productivity and private investment. Hires and separations for the month, on a month over month basis changed very little. The full report is available here: jolts report 10 2023 Below is a chart by industry illustrating the changes in job openings. I have highlighted the data points that jumped out at me.

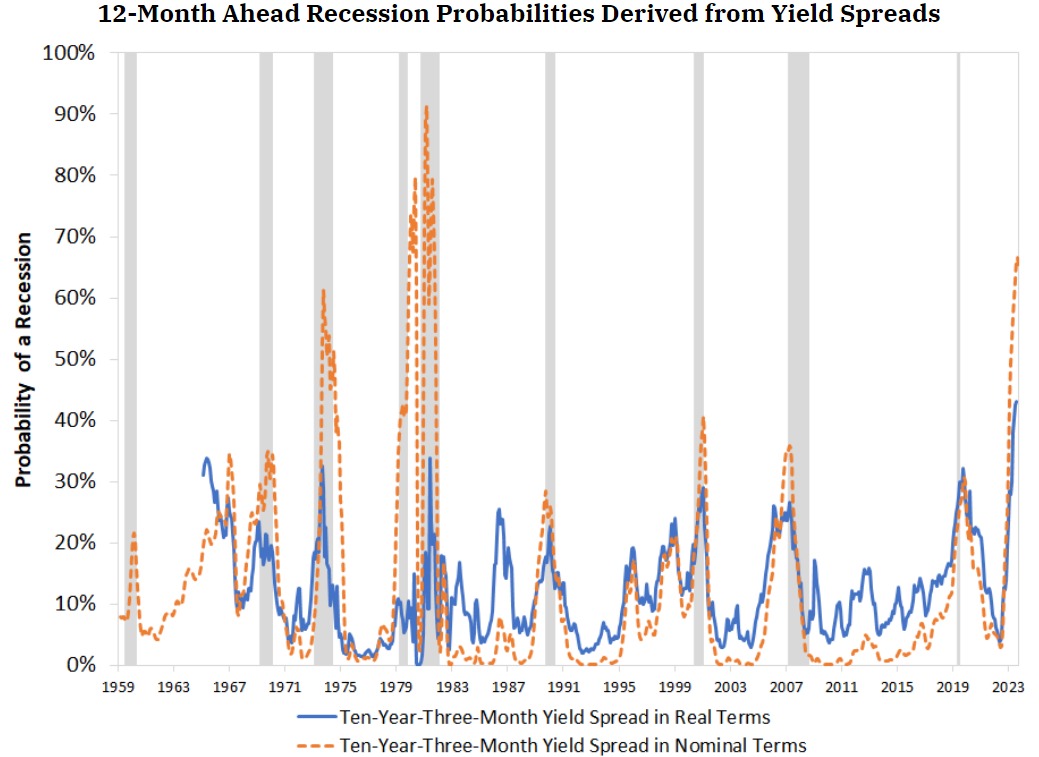
Softer job openings are a sign of slowing economy. The move for October was large and unexpected. In turn, the bond market, namely Treasuries, reacts. One of the best predictors of recession is the yield curve or more specifically, the spread between the three-year Treasury and the ten year. The inversion in the curve, where short term bond yields are higher than longer term bonds, is indicative of the market assuming reduced economic activity in the future.
The spread however, between three year and ten year securities is considered a more active predictor by probability.

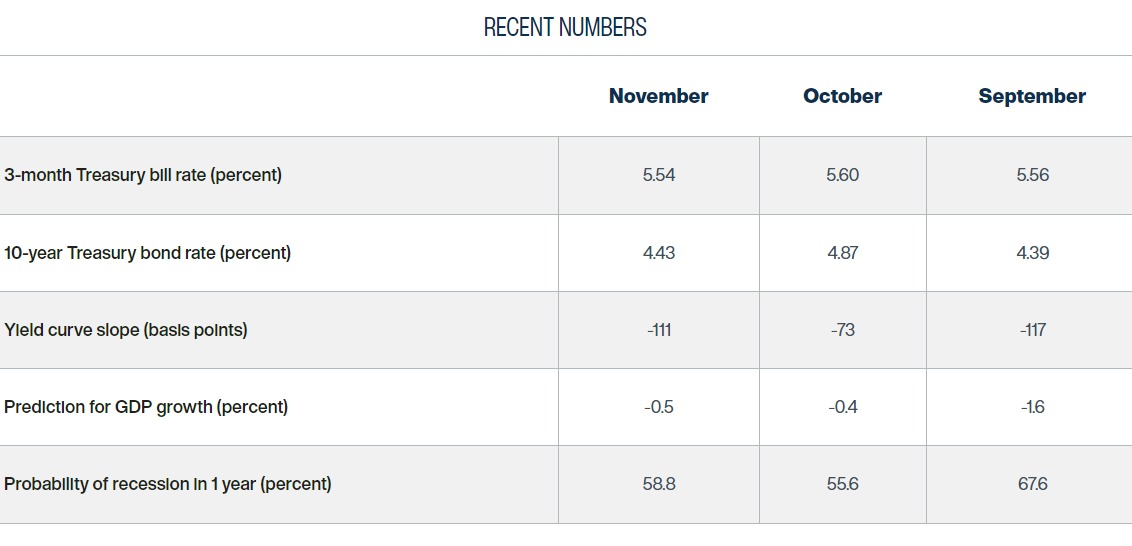
For example, the nominal yield spread is currently negative—low by historical standards—and predicts a 65% probability of recession in 12 months. Likely, within the next few days, as the bond market digests the JOLTS report, the spread will widen.

Some numbers from the Cleveland Fed make this relationship a bit easier to see.

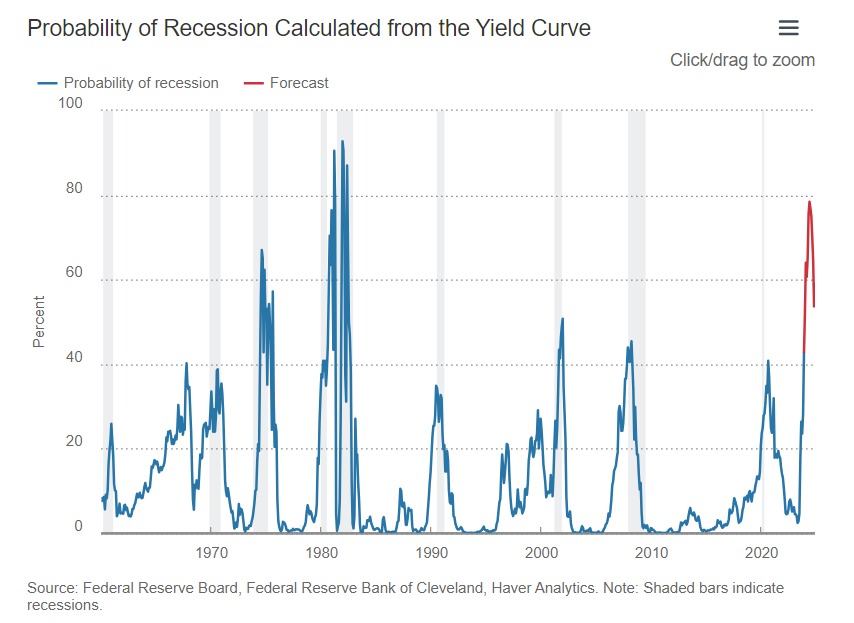
The probability chart below is one I like as it is interactive on the Cleveland Fed site or in other words, you can see the forecast for likely recession by tracking the lines with your cursor (unfortunately, not on this page). The Cleveland Fed link for this chart is here: https://www.clevelandfed.org/indicators-and-data/yield-curve-and-predicted-gdp-growth

The orange segment of the line is telling us that the Cleveland Fed is predicting the probability of recession as 64% in January of 2024 and reaching as high as 78.5% by August of 2024.
So (rhetorically posed), are we in a recession or near? As is true with economists, some say yes, some say not yet, and some say not necessarily anytime soon. The probability is growing, and this JOLTS report will bolster, that the Fed is done hiking rates. If so, then the question begs, when do rates fall? Again, more data is needed to forecast a reduction but IF, a recession is nigh, say early 2024, the Fed is likely to reduce rates sooner rather than later. My guess, the first rate cut will occur in the 2nd quarter of 2024 (April).
Happy Hump Day! And, as of today, only 19 shopping days remain until Christmas!